
The Stock Market Isn’t The Economy, and Neither is Inflation.
- David Abam

- Oct 27, 2025
- 23 min read
Updated: Oct 28, 2025
An analysis of the diverging economic reality of Wall Street v Main Street

“For to everyone who has will more be given, and he will have an abundance. But from the one who has not, even what he has will be taken away.” Matt 25:29 ESV
In April of this year (2025) Trump sent shockwaves when he announced tariffs on his so-called Liberation Day, with many news outlets reporting that there was about $8.5 trillion wiped out in the value of financial assets on the stock market, and even more news outlets stating that the economy is in free-fall. Although the stock market has not just largely rebounded, but has even reached new all-time highs, it is only recently that the American consumer is feeling the effects of the tariffs, as they are to pay over $600 billion in tariff-related expenses. This is a brief description of the chasm that exists between those who live comfortably on Wall Street, as opposed to those who are only getting by on Main Street.
This essay argues that the contemporary definition of a "strong economy" is fundamentally fractured. By examining key metrics, a stark divergence emerges between a booming financial asset economy, driven by stock and housing markets (Wall Street), and a stagnating household experience economy, defined by inflationary pressures and stagnant real wages (Main Street). This phenomenon will be illustrated through a comparative analysis of the United States, the European Union, and the United Kingdom.
In simple terms, I will show that the two economies exist in parallel to each other, and headlines such as the stock market hitting all-time highs or a rise in car loan defaults should be viewed in context for the growth of the entire economy. My analysis would present and explain reputable data from the US, the UK, the EU,
To dissect this dual reality, the structure of this analysis will mirror the very schism it examines. We will first enter the world of Wall Street, defining its contours and presenting the data that illustrates its parabolic growth since 2020. This will immediately be followed by a descent to Main Street, where we will define the median household's economic experience and present the contrasting data on wages, costs, and sentiment. This side-by-side exposition of data, from the S&P 500's ascent to the stagnation of real wages, will make the divergence viscerally clear. Finally, having established the 'what,' we will analyse the 'why,' arguing that the confluence of share buybacks, the resource-intensive AI boom, and unintelligent trade wars are systematically engineered to widen this chasm.
Part 1: The Economy according to Wall Street
The Financial Asset Economy
Portfolio being the operative word for those in this class. They own assets that appreciate over time. This is inclusive of pensioners with decades of paying into their retirement accounts, small business owners who set aside money every month for years, and tech executives who have equity that has vested. It is important to note that their assets allow them to increase or maintain their lifestyle through capital appreciation, dividend payments, or the Buy-Borrow-Die method discussed in the last analysis, without having to work to earn an income. It is not as simple as it seems because you would need about £700,000 invested in high dividend paying companies to earn about £1500 monthly, alternatively, it's advised that you live on at most 3% of your portfolio per year; for that you would need a portfolio of at least £2,000,000 to be able to have a £60,000 yearly income.
The primary indicators of those within this class would be the owning of liquid assets or assets that can be easily liquidated (sold for cash). An obvious example would be the ownership of individual stocks and shares, or the ownership of ETFs, ownership of commodities like precious metals/stones, and it also includes other assets such as cryptocurrencies. The house that the person lives in is debatably not an asset; however, if they do not live in it, then that is an asset, even when there’s no one else living in it, the home appreciates. Assets such as fine art, wine, and even equity holdings in private companies are difficult to accurately price and even harder to liquidate without taking huge financial losses.
Over the last five years, all asset classes have experienced significant growth in value, with some increasing more than double in value. To establish my argument, we would be looking at the growth in value of the stock market indexes [the S&P 500, the NASDAQ 100, and the Russell 2000], and Home prices. I will then use the data to show the occurrence of the trend across the pond, using their stock market indexes [The FTSE 100 and the Euro Stoxx 50] and their home prices too. I will then show the data for other assets such as Gold and Bitcoin. The next few parts would be chart-heavy with explanations that follow.
The S&P 500
This index tracks the performance of the largest 500 public companies in America, and is the most popular index in the world. This, on average, has produced around a 15% return on investment in the last 5 years and has cumulative returns of 148% in the same time frame. Putting that in perspective, $10,000 invested in January 2020, without any additional investment, would be worth $24,840 today.

The NASDAQ 100
Although sharing similarities with the original NASDAQ ($IXIC), which has over 3,300 companies, the NASDAQ 100 (NDX) only has 101 within it. It is a tech-heavy index and, for that very reason, has enjoyed astronomical gains in the past 5 years. It has posted 267% returns over that same period. Putting that in perspective, using the same analogy for as before, the $10,000 invested in January of 2020, without any additional investment, would be worth $36,700 today.

The Russell 2000
This is a stock market index that tracks the value of approximately 2,000 US stocks with a small market capitalization. Market capitalization is a way of expressing a company’s total value, and it’s found by multiplying the number of outstanding shares by the share price. As small-cap stocks, companies in the Russell 2000 have a relatively low total value in comparison to mid- and large-cap companies. The index summarizes the average performance of all its stocks in just one number. In the past 5 years, it has delivered returns of over 138%. Which means your $10,000 invested in 2020 would be worth $23,900 today.

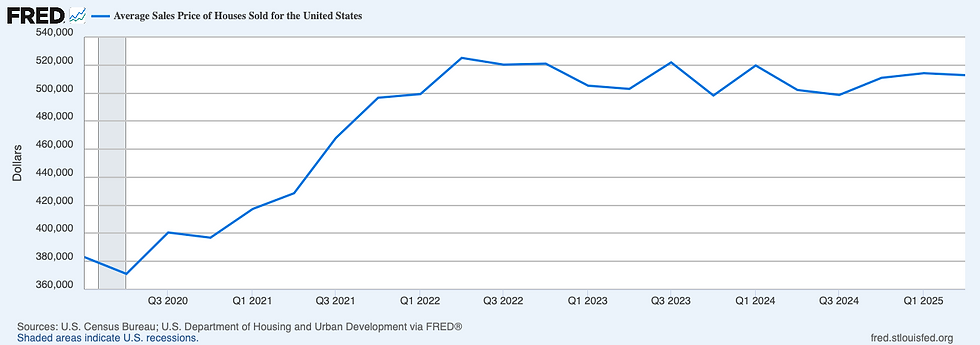
House Prices
Home prices have been on the rise since they became commodities; however, from 2010 to 2020, the average home price rose by about $100,000 from around $280,000 in 2010 to a peak of $380,000 in 2019. It is important to note that this growth occurred in a 0% interest rate environment.

However, that explodes from 2020 onwards; what took over 10 years between 2010 and 2019 occurred in just a year. At its peak in Q2 of 2022, average house prices were a little over $520,000, a rise of over $150,000.
The FTSE 100
The Financial Times Stock Exchange 100 Index, also called the FTSE 100 Index, FTSE 100, FTSE, or, informally, the "Footsie", is one of the United Kingdom's best-known stock market indices and represents the 100 most highly capitalized blue chips listed on the London Stock Exchange. It is the UK’s equivalent of the S&P 500. Over the past 5 years, although nowhere near the NASDAQ or S&P 500, it has delivered a respectable 70% return on investment. This means that £10,000 invested in January 2020 would be worth £17,000 today.

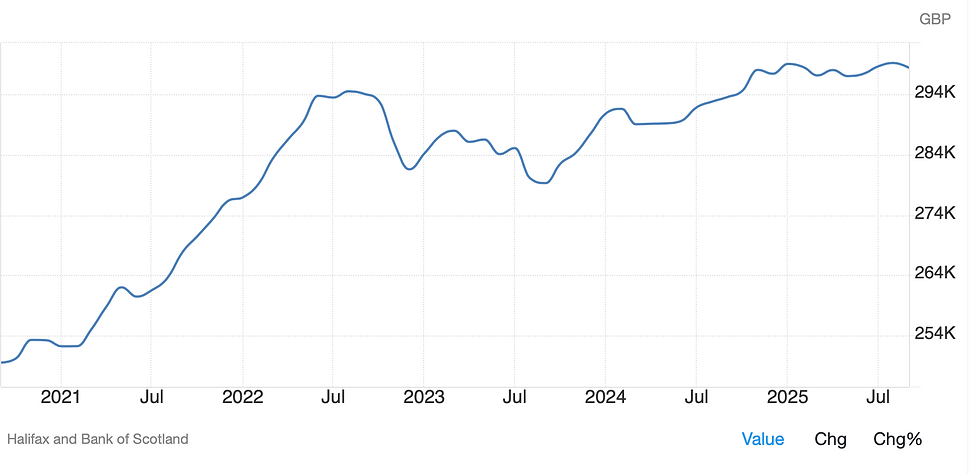
UK Home Prices
In the UK, average home prices have risen dramatically. During the 5 years from 2016 - 2021, average home prices rose by about £36,000.

However, from Q1 of 2021 to Q2 of 2022, a little over a year, average home prices rose by about £46,000. Rising from an average price of £254,000 to an average price of £295,000, and now sits just under £300,000
The Euro Stoxx 50
The Euro Stoxx 50 is a stock index of Eurozone companies created by STOXX, an index provider owned by the Deutsche Börse Group. The index includes 50 stocks from 11 Eurozone countries. EURO STOXX 50 represents leading blue-chip companies in their sectors within the Eurozone. It's similar to the EU’s version of the S&P 500. Over the past 5 years, it has delivered impressive returns of 136%. This means that the €10,000 invested in January 2020 would be worth €23,600 today.

Bitcoin
The cryptocurrency that needs no introduction, Bitcoin’s value has tripled from around $40,000 for one to around $120,000 in just 5 years. Effectively making the $10,000 that was invested in 2020 worth over $30,000 today.

GOLD
The precious metal that needs no introduction. This has been used as a store of value for millennia and is used as that now, as investors flee their dollar holdings and invest in Gold. It has caused a parabolic rise in the price of Gold over the past 5 years, but even more so in the last year. It hovered around $2,000 per ounce from 2021 and began its meteoric rise in January of 2024. In 2025 alone, it has ballooned from slightly above $2,500 per ounce, and it now sits around $4,300 per ounce.

The S&P 490 and The S&P 10
There is a fascinating concept that is repeated when discussing the weighting, i.e., the percentage of the index that is given to a company, which constitutes the S&P 500. The S&P 500 is weighted by market capitalization. This means a stock with a $1 trillion market cap will have 10 times the weighting as one with a $100 billion market cap. The top 10 companies in the S&P 500 account for 40% of the index. Since the release of ChatGPT in November 2022, AI-related stocks have registered 75% of S&P 500 returns, 80% of earnings growth, and 90% of capital spending growth. It is a hypothesis that states that without these AI companies and their subsequent capital expenditure on AI, not only would there be a flat rate of growth for the index, but there would a flat rate of growth of the US GDP.
The Magnificent 10, in essence, is doing all the heavy lifting when it comes to the growth of the index as a whole, but it also means that 40% of the S&P 500 and the entire economy of the United States is one big bet on AI. So much so that if Mag 10 valuations are cut in half, the S&P and global markets would decline by 20% and 10%, respectively.
Nvidia [7.25%]
Microsoft [6.4%]
Apple [6.36%]
Amazon [3.85%]
Meta Platforms [3.04%]
Broadcom [2.66%]
Google Class A shares [2.61%] and Class C shares [2.44%]
Tesla [2.33%]
Palantir [0.69%]
AMD [0.62%]
This is painfully clear when considering the stark difference in growth of their Mag 10’s net income as compared to the other 490 companies in the index.

What Does This Mean?
In America, the wealthiest 1% of their population own 50% of stocks, and the wealthiest 10% own 87% of stocks. This means that for the top 10%, the economy is doing just fine, and they are geared to spend even more. In fact, the top 10% account for half of all consumer spending, which has encouraged companies to raise prices as they turn their focus on catering more to that market. For example, Delta Airlines, in its Q2 2025 report, stated that consumer spending from its wealthier customers fuelled nearly 95% of its revenues. Walmart’s CEO stated in its Q2 2025 report that “We're also seeing higher engagement across income cohorts, with upper-income households continuing to account for the majority of gains.” American Express increased the fees for its higher-tier cards (Gold, Silver, Black & Platinum) while simultaneously reducing the number of points earned per dollar spent, which means that those with the means to spend even more gain more points.
The problem with catering specifically to only wealthier people is explained intelligently, even though slightly dramatically, by Professor Galloway. He says “If the top 10%, who account for half the consumer spending in the U.S., hit the brakes, the nation gets whiplash. I estimate that if the wealthy see their portfolios drop by 20%, we could see a 2–3% decline in GDP. For context: From peak to trough, the Great Recession registered a 4.3% drop in GDP” I agree to the extent that should anything happen to the stock market the wealthy can easily cut their spending back by 30% at the very least, however, what would it mean to a company like Delta if the bloc that accounts for 95% of their revenues cut their spending back by 30%, it is a single point of failure (SPOF) risk. Just like a game of musical chairs, as long as the music is still playing, the wealthy remain confident in their dance.
Part 2: The Economic Reality on Main Street
The Median Household Economy
The median household would be described as one who even though might have a pension, but does not own individual stocks, and even if they do, it is an insignificant stake. They end up bearing the brunt of macroeconomic situations and adverse foreign policies while having little influence over it. The median household is struggling with debt and is barely able to afford a $1,000 emergency expense. The data shows that there is an increasing level of pessimism about their future as they truly believe they may never be able to afford the basic markers of adulthood, such as a house or even kids.
There are a few primary indicators that are common with those in this class. They are typically lower-middle-class individuals and are only one emergency away from being homeless and losing everything. Their earnings are fragile, and they rely a lot on debt just to afford basic necessities.
A Broken Social Contract
There was an understanding whereby if you took out a hefty loan to gain a university education, and when you finish, you will get a stable job with a liveable wage in a company that you stay for your entire career life. That job not only enables you to pay back those hefty loans, but it also allows you to buy a house, save for retirement, and enjoy a comfortable life. It was also understood that layoffs happen few and far between, in times of economic difficulty, and it was the worst-case scenario for a company. This path worked for decades before you, so you had no reason to believe that the party would stop just when it’s your turn. However, in the past 5 years, it seems the social contract is broken, this is because the largest companies initially overhired post-pandemic, and now they are overcorrecting by insisting on running leaner than ever. The largest employers would announce record-breaking profits, and a few weeks later, announce sweeping layoffs in the thousands or sometimes the tens of thousands. In 2023, there were tech layoff announcements every month industry, 262,735 people impacted (719 people per day), in the same year that the tech-heavy NASDAQ posted returns of around 54% (its best year since 1999).
This has caused such rippling effects in the job market, whereby just to get by, someone who was laid off and has 5-7 years of experience, applies for and accepts an entry-level role, a role that they are overqualified for, underpaid, and essentially demoted. This pushes out those who are new graduates from having a chance to compete against someone who the company sees as a bargain, a more experienced candidate for less. This leads to a situation in whereby a coffee barista holds a postgraduate degree because that is the only job they can get.
Wage Stagnation
The thing about wage stagnation that is often misunderstood is that if your 2025 pay rise is in line with or above the rate of inflation, then your wages have kept up with inflation. As such, a direct 1-to-1 comparison is made between the inflation rate and a rise in pay over the past 5 years; one could easily argue that wages have not necessarily been stagnant. However, a closer examination would reveal that while headline inflation has cooled significantly from its peak, this metric is often misread. A lower inflation rate does not mean prices are falling, but rather that they are continuing to rise at a slower pace. The economy has not reversed its trajectory; it has merely downshifted. Consequently, the consumer price level remains permanently higher, locked in at a new, elevated plateau. For a household, this means that income must not merely keep pace with current inflation but must grow enough to close the substantial gap created by the cumulative price increases of the last several years. Earning a 4% raise in a 3% inflation environment represents a marginal gain, but it fails to recover the 20%+ of purchasing power already eroded since 2021.
The chart below is from the Office for National Statistics in the UK, but the EU and the US charts and inflation data tell a similar story. As you can see, for 8 months from April 2022 to March 2023, inflation hovered at around 10% every single month; as such, for wages to have kept up with the rate of inflation, a pay rise of 10% every month would have been necessary. That is an unreasonable ask as pay rises are given once a year, and are only 5% on average

Stealth Inflation
We have discussed the explicit type of inflation that is tracked by the government via metrics such as the price of energy, food, etc, and is used to generate the consumer price index around the world. However, there are stealthier price rises that added to what was colloquially termed in the UK as the cost of living crisis. There is a myriad of things that can be discussed here; however, I will briefly state just 2.
Insurance Costs: In the last 5 years, the cost of insurance premiums has become astronomical. In the US, home insurance prices have soared to up to 50% and car insurance premiums have risen over 36%. Government data from the UK shows that there has been a 30% increase in home insurance premiums, and worse still is the 82% parabolic rise in the cost of car insurance premiums.
Fees: Over the past five years, it is estimated that the average UK household has paid an additional £100 in credit card interest and fees, while the average US household has paid an additional $540. This is calculated by calculating the yearly interest paid on the average credit card debt and finding the difference. Furthermore, it is reported that the Lloyds Banking Group (Lloyds, Halifax, and Bank of Scotland) has announced that they would be charging up to 50% interest on their overdraft charges.
Consumer Sentiment
Also known as consumer confidence is defined as the overall attitude and optimism of consumers regarding their financial health and the economy, used as a key economic indicator to predict future spending and economic trends. It is measured through surveys that gauge how people feel about the present and future state of the economy and their personal finances, influencing overall economic activity because consumer spending is a major part of GDP.
As such, it is an indicator that could either discredit or support this piece’s argument that the median household feels very different about the state of their finances and the economy. I will rely on a few handy charts to support my argument.
In the US, the consumer sentiment index is tracked by the University of Michigan and is a reliable source of data for the US consumer. Per their data over the past 5 years, even though there have been swings upwards, the trend shows that consumer sentiment is on the decline, and it is the lowest it has been in the same time frame. It declined 47% from its peak in February of 2020.

In the UK, the consumer sentiment index tracked by GfK, a global market research and analytics company, and the trend differs slightly. Per GfK data, consumer confidence has had downward swings and has rebounded, but over the past 5 years, it has remained relatively flat. To understand the chart below, you need to be aware that a reading above zero indicates optimism; below indicates pessimism.

Within the EU, the consumer confidence index is tracked by the European Commission, and the trend mirrors the UK. The data shows that even though it peaked in June 2021 and bottomed out in September 2022, the overall 5-year trend shows that consumer confidence remained relatively flat at around -14. Remember that a reading above zero indicates optimism; below indicates pessimism.

What Does This Mean?
The median household can barely catch a break. The job market they have come to understand is irreparably broken. They experience a unique difficulty even landing a job with three major opponents to contend with: the rise of job postings that the business has no intention of hiring for, people willingly applying for roles they are overqualified for, and being filtered out by poorly instructed AI sorting systems. In the slim chance they do land a job, they live acutely aware that they might be among those affected in an unseen round of layoffs and have to start the entire process once more. If you want more “boots on the ground” data to really explain how terrible the job market is worldwide, just go to Reddit and look through the subreddit that is called r/recruitinghell. It has grown 6-fold since January 2020, and because the majority of Reddit users are anonymous, they are free to tell their job-searching stories. I suggest you read it with a healthy amount of skepticism.
After staying in a job for years, they realise that their monthly paycheque doesn’t last until the end of the month, even though their lifestyle hasn’t necessarily increased. They have been saving diligently, only to have those savings eroded by the new cost of the car insurance. That same day, their newsletter of choice, Read It And Eat, reports that the federal government is not only ending the moratorium for their student loan payments, but will be garnishing their wages to have it paid. As they continue reading that day’s issue, they realise that Disney+, Spotify, and Netflix are all raising their subscription prices.
At the end of the month, they look at their spreadsheet, and they realise that between the rising costs and additional fees, not only would they save less per month, but they have to deduct from their savings pot. The salary raise puts them in a new tax band, which means they pay more in taxes but have an insignificant net increase in their income. The house deposit they thought they would be able to save up for in 5 years has to be delayed by another 3 years. Understandably, their economic and financial outlook is pessimistic, and when they read in the news that the economy has never been better, they scoff and categorise those on Wall Street as out of touch with reality.
Part 3: Analysis
From A Small City Street To A 16-Lane Highway
If this piece attempts to address every single reason as to why the wealth divide between Wall Street and Main Street, it would evolve into a dissertation for a postgraduate degree in Economics, and given the heavy usage of charts, the use of terms like CPI and consumer sentiment, I’d say it's not far off from it. However, of the myriad reasons the wealth divide continues to widen into the 16-lane highway in 2025, I will briefly detail three below and elaborate on how they directly add to the widening wealth inequality that exists today.
1. Share Buybacks
Whenever a company makes a profit, it has a plethora of options for what it could use that profit to do. Prior to 1982, companies could either give those profits to shareholders as dividends, distribute them within the company in the form of bonuses, or significant salary increases, and/or increased workplace benefits for their staff, etc. However, in 1981 in the UK, via the Companies Act 1981, and in 1982 in the US, with the SEC Rule 10b-18, came the legalisation of the Share Buyback. A share repurchase, or share buyback, is when a company repurchases its own shares and returns funds to its investors. The issuing company usually acquires its own stock by distributing cash to existing holders, paying the market value per share, in exchange for a portion of the company’s outstanding equity. When a company repurchases its own shares, this reduces the number of shares held by the public. Companies can purchase the stock on the open market or from shareholders directly. When a company repurchases its own shares, it reduces the number of shares held by the public.
On the surface, it seems innocuous and maybe even irrelevant to state because, it is only those who wish to sell their shares for cash that would it would be paid out to. However, economics 101 teaches the law of supply and demand. When applied to this situation, share prices rise and fall by the amount of demand for the shares in circulation. If the number of shares in circulation is reduced, or if there is a sudden rise in demand for the shares that are in circulation, it inevitably means the share price will rise. Simplified; companies use profits to manipulate the price of their shares.
Furthermore, there is one more finance term you should be aware of, it is called Earnings Per Share (EPS). It simply means how many dollars the company earns as compared to the outstanding number of shares. An oversimplified example is that if a company XYZ has a million shares and earns $10 million in Q1 of 2025, then its EPS is $10. However, if the same company completes a share repurchase of 500,000 shares and earns $10 million in Q3 of 2025, its EPS on the outstanding 500,000 shares jumps to $20.
How does this contribute to wealth inequality?
First, money that could have been redistributed to their employees is used for these repurchases. For example, in January of this year, Apple completed a share repurchase of $100 billion. Apple directly employs about 90,000 people in the US alone. If that money were redistributed equally, every single employee would have been paid a sum of $1.1 million. Instead, they completed a layoff that affected hundreds of workers in their digital services division.
Secondly, executive compensation is usually tied to targets on both share price and earnings per share. It becomes increasingly difficult to continue beating analyst estimates every quarter when you are a corporation as large as Google, so it becomes an easy way to boost the share price and EPS in the short term. In a way, it uses the profit to prop up and hold the company's valuations at such levels, without having to innovate or grow.
“Show me the incentives and I will show you the outcome.” Says Warren Buffett. It applies immensely in this case, as share repurchases are the next thing that Wall Street is incentivising. In 2012-2021, investors incentivised growth at all costs, foregoing profits to obtain market share, as such rounds of layoffs were few and far between. In 2021-2024, the opposite was true; investors rewarded companies that ran a smaller and leaner operation, as such, there was a direct increase in share price whenever a round of layoffs was announced, even when the company on the same earnings call had announced record profits. Now, companies and their executives are incentivised to undertake these astronomical buybacks, leading to the situation whereby companies, from March 2024 to March 2025, have spent nearly $1trillion on share repurchases. Wealth that could have gone into research and development, charitable causes, or even a simple redistribution among their employees. It's a direct transfer from long-term, shared prosperity to immediate, shareholder-centric wealth. Trickle Down economics, my ass.
2. AI Infrastructure
I need to initially state that I believe that AI is a revolutionary product akin to the Internet, and I am a supporter of its advancement to an extent. That being said, when considering the astronomical amount of electricity these data centres demand, data centres being the central nervous system of AI technology, it is staggering. Estimates by Alex de Vries-Gao, the founder of the Digiconomist tech sustainability website, came as the International Energy Agency forecast that AI would require almost as much energy by the end of this decade as Japan uses today. Alex de Vries-Gao estimates that AI consumption could reach 23 gigawatts (GW), the research estimates, twice the total energy consumption of the Netherlands.
Beyond the energy requirements, these data centres also require an enormous amount of water to keep their processors cool. AI needs a lot of servers to run, and those servers get hot. To stop them from overheating, you need serious cooling. A standard method is evaporative cooling. The problem is, this process is thirsty. About 80% of the water used evaporates, so you have to constantly pump in fresh water. Not just any water, it often has to be clean, drinkable water to keep the system from getting clogged with gunk. The bottom line is that this constant demand for fresh water can drain local water sources and mess with the surrounding ecosystem, like fish and other aquatic life.
OpenAI alone plans to “spend” $1 trillion over the next 10 years to build out the data centre infrastructure for AI computing, citing a surge in demand. How they are able to afford such an amount without more venture funding or debt is to be dictated by time, as it has been reported that in the first half of 2025, OpenAI had revenues of $4.3 billion and posted a net loss of $13.5 billion. Furthermore, the frenzy of data center buildout has caused a secondary market to boom, whereby institutions like J.P. Morgan, Blackstone, and other financial giants are buying “industrial outdoor storage” [parking lots] sites near these data centres and charge fees for the use of that land as a storage space when constructing these data centres.
How does this contribute to wealth inequality?
The answer is simple: the risk is socialised while the reward is privatised. With every partnership deal that OpenAI announces with a public company for an AI data centre and compute buildout, the shares of that company soar, the biggest example being Oracle shares rising 46% in a single trading day after it announced its partnership with OpenAI worth $500 billion. Meanwhile, due to the very same data center buildout, those who live within 50 miles of a data centre have seen their electricity bills skyrocket. Wholesale electricity costs have increased as much as 267% since 2020 in areas near data centres. In the US, about two-thirds of the country’s power consumption runs on either a state or regional grid, which means that the usage is per household consumption, but the average usage of the entire county.
It’s also just unfair. Tech companies and their backers are pouring hundreds of billions of dollars into AI infrastructure right now, which may or may not ultimately pay off, but offloading costs onto regular people who are already struggling with sky-high inflation isn’t part of any reasonable deal.
Furthermore, these data centres are not only causing the cost of electricity to rise, but they are also using up the surrounding town’s drinkable water to cool their systems. It is estimated that AI-driven data centres could consume 1.7 trillion gallons of water globally by 2027. This is more than 4-6 times the total annual water withdrawal of Denmark. Those who would be affected the most are the impoverished rural areas where these data centres are built. This is a de facto tax that hits the poor hardest to fund a speculative boom that primarily benefits the rich. This isn't just an "unfair cost"; it's an active, systemic transfer of wealth upwards.
3. Unintelligent Trade Policies
As an avid reader of the Read It And Eat newsletter, you should be aware of the "Liberation Day” tariffs that were announced by Trump himself. We covered it in much detail in our Tariff Engineering piece. However, to reiterate, a tariff or import tax is a duty imposed by a national government, customs territory, or supranational union on imports of goods and is paid by the importer. These additional costs are usually passed on to the end consumers. In an ideal world, it is used to make those imported goods less unaffordable compared to locally made products; however, there needs to be local production for the tariff to really make sense.
That being said, what has become clear in the months since is that not only does Trump Always Chicken Out [TACO] when it comes to following through with the tariff threat, but if you are influential enough and you come to “kiss the ring,” you would have exemptions carved out for you. Apple CEO Tim Cook, President Donald Trump, with a one-of-a-kind, U.S.-made glass plaque, and walked away with an assurance that Apple will be spared from a looming 100% tariff on imported semiconductors and chips. Another example is when Nvidia’s CEO Jensen Huang had a meeting with Trump and walked away with the license for Nvidia and AMD to sell their computer chips to China if they paid the US government 15% of their China revenues. The US had previously banned the sale of powerful chips used in areas like artificial intelligence (AI) to China under export controls usually related to national security concerns.
How does this contribute to wealth inequality?
The most recent CPI report shows that inflation remains at 3%, which means that the tariff costs are yet to be passed on to the consumer and are still being borne by the American companies importing these goods. However, US consumers will likely shoulder 55% of tariff costs by the end of the year, with American companies taking on 22%, the Goldman analysts wrote in an Oct. 12 research note to clients. Foreign exporters would absorb 18% of tariff costs by cutting prices for goods, while 5% would be evaded, they wrote. In essence, the median household is about to feel even more of a pinch because of these tariffs and is incapable of doing anything to change it.
The U.S. exported $12.6 billion in soybeans to China in 2024, nearly equal to the total amount exported to the rest of the world combined, making it one of America's most significant agricultural exports. However, China imported no soybeans from the U.S. in September, the first time since November 2018 that shipments fell to zero. One thing about brazen and unintelligent trade policies is that there would be consequences. In this case, China executed this strategy masterfully and has already begun fulfilling its demand for soybeans from countries such as South Africa, Argentina, and Brazil. Unfortunately, the lowly American soybean farmer who operates on razor-thin margins has to bear the brunt of the collapse of the $12 billion marketplace, due to no fault of their own. If not for the bailout package, money that is gotten from the tariffs, these farmers may likely have gone out of business. This destroys the foundational idea of a fair market and explicitly picks winners (the large, politically-connected corporation) and losers (the small farmer, the median consumer).
Conclusion
So, what really is the economy? The evidence confirms it is not a single entity but a fractured reality. For the asset-owning class, it is a booming financial engine, a testament to the ancient truth that ‘to everyone who has, more will be given.’ For the median household, it is a daily grind of stealth inflation, fragile employment, and a pessimistic outlook, where ‘even what they have is being taken away.’ We have found a staggering concentration of wealth within the already wealthy, where the S&P 10 propels the entire index while the S&P 490 trails behind.
The mechanisms are no accident. Share buybacks redirect corporate wealth from paycheques to portfolios. The AI infrastructure socialises its colossal water and energy costs on the public while privatising its gains. Unintelligent trade policies shield the powerful with exemptions while passing the bill to the consumer and the isolated farmer.
This is not a sustainable equilibrium; it is a pressure cooker. The music of low interest rates and speculative fervour is still playing for Wall Street’s dance, but on Main Street, the chairs are being taken away. The fundamental contract is broken. Until we acknowledge that a stock market index is not the economy, and that inflation ‘cooling’ doesn’t heal the wound, the chasm will only widen, risking a convulsion that, history shows, eventually reaches every street, even those paved with gold.


Comments